
How to Read a GEX Chart like a Great Tight End Runs Routes into His Lover’s Heart
With Bonus Play-By-Plays 🏈 and Assorted Expected Chocolates 💝 for the Week Ahead


So, how do you read a GEX chart?
“I’ll do you one better, What is GEX?”
“No. I’ll do YOU one better. WHY is GEX?”
GEX, or a Gamma Exposure Index, is a fancy way of talking about the yard lines on the stock market playing field… of love… yes, we have Super Bowl plus Valentine’s Day happening this week so we will be mixing metaphors.
Love is such a heartwarming emotion. Some of us love stocks. Others, world famous pop stars. And some are caught in the throes of a torrid passion for tariffs.
For a short-term trader, the first love will always be the GEX chart.
Below is the current net gamma exposure courtesy our good friends at GammaLab ( https://gammalab.io)
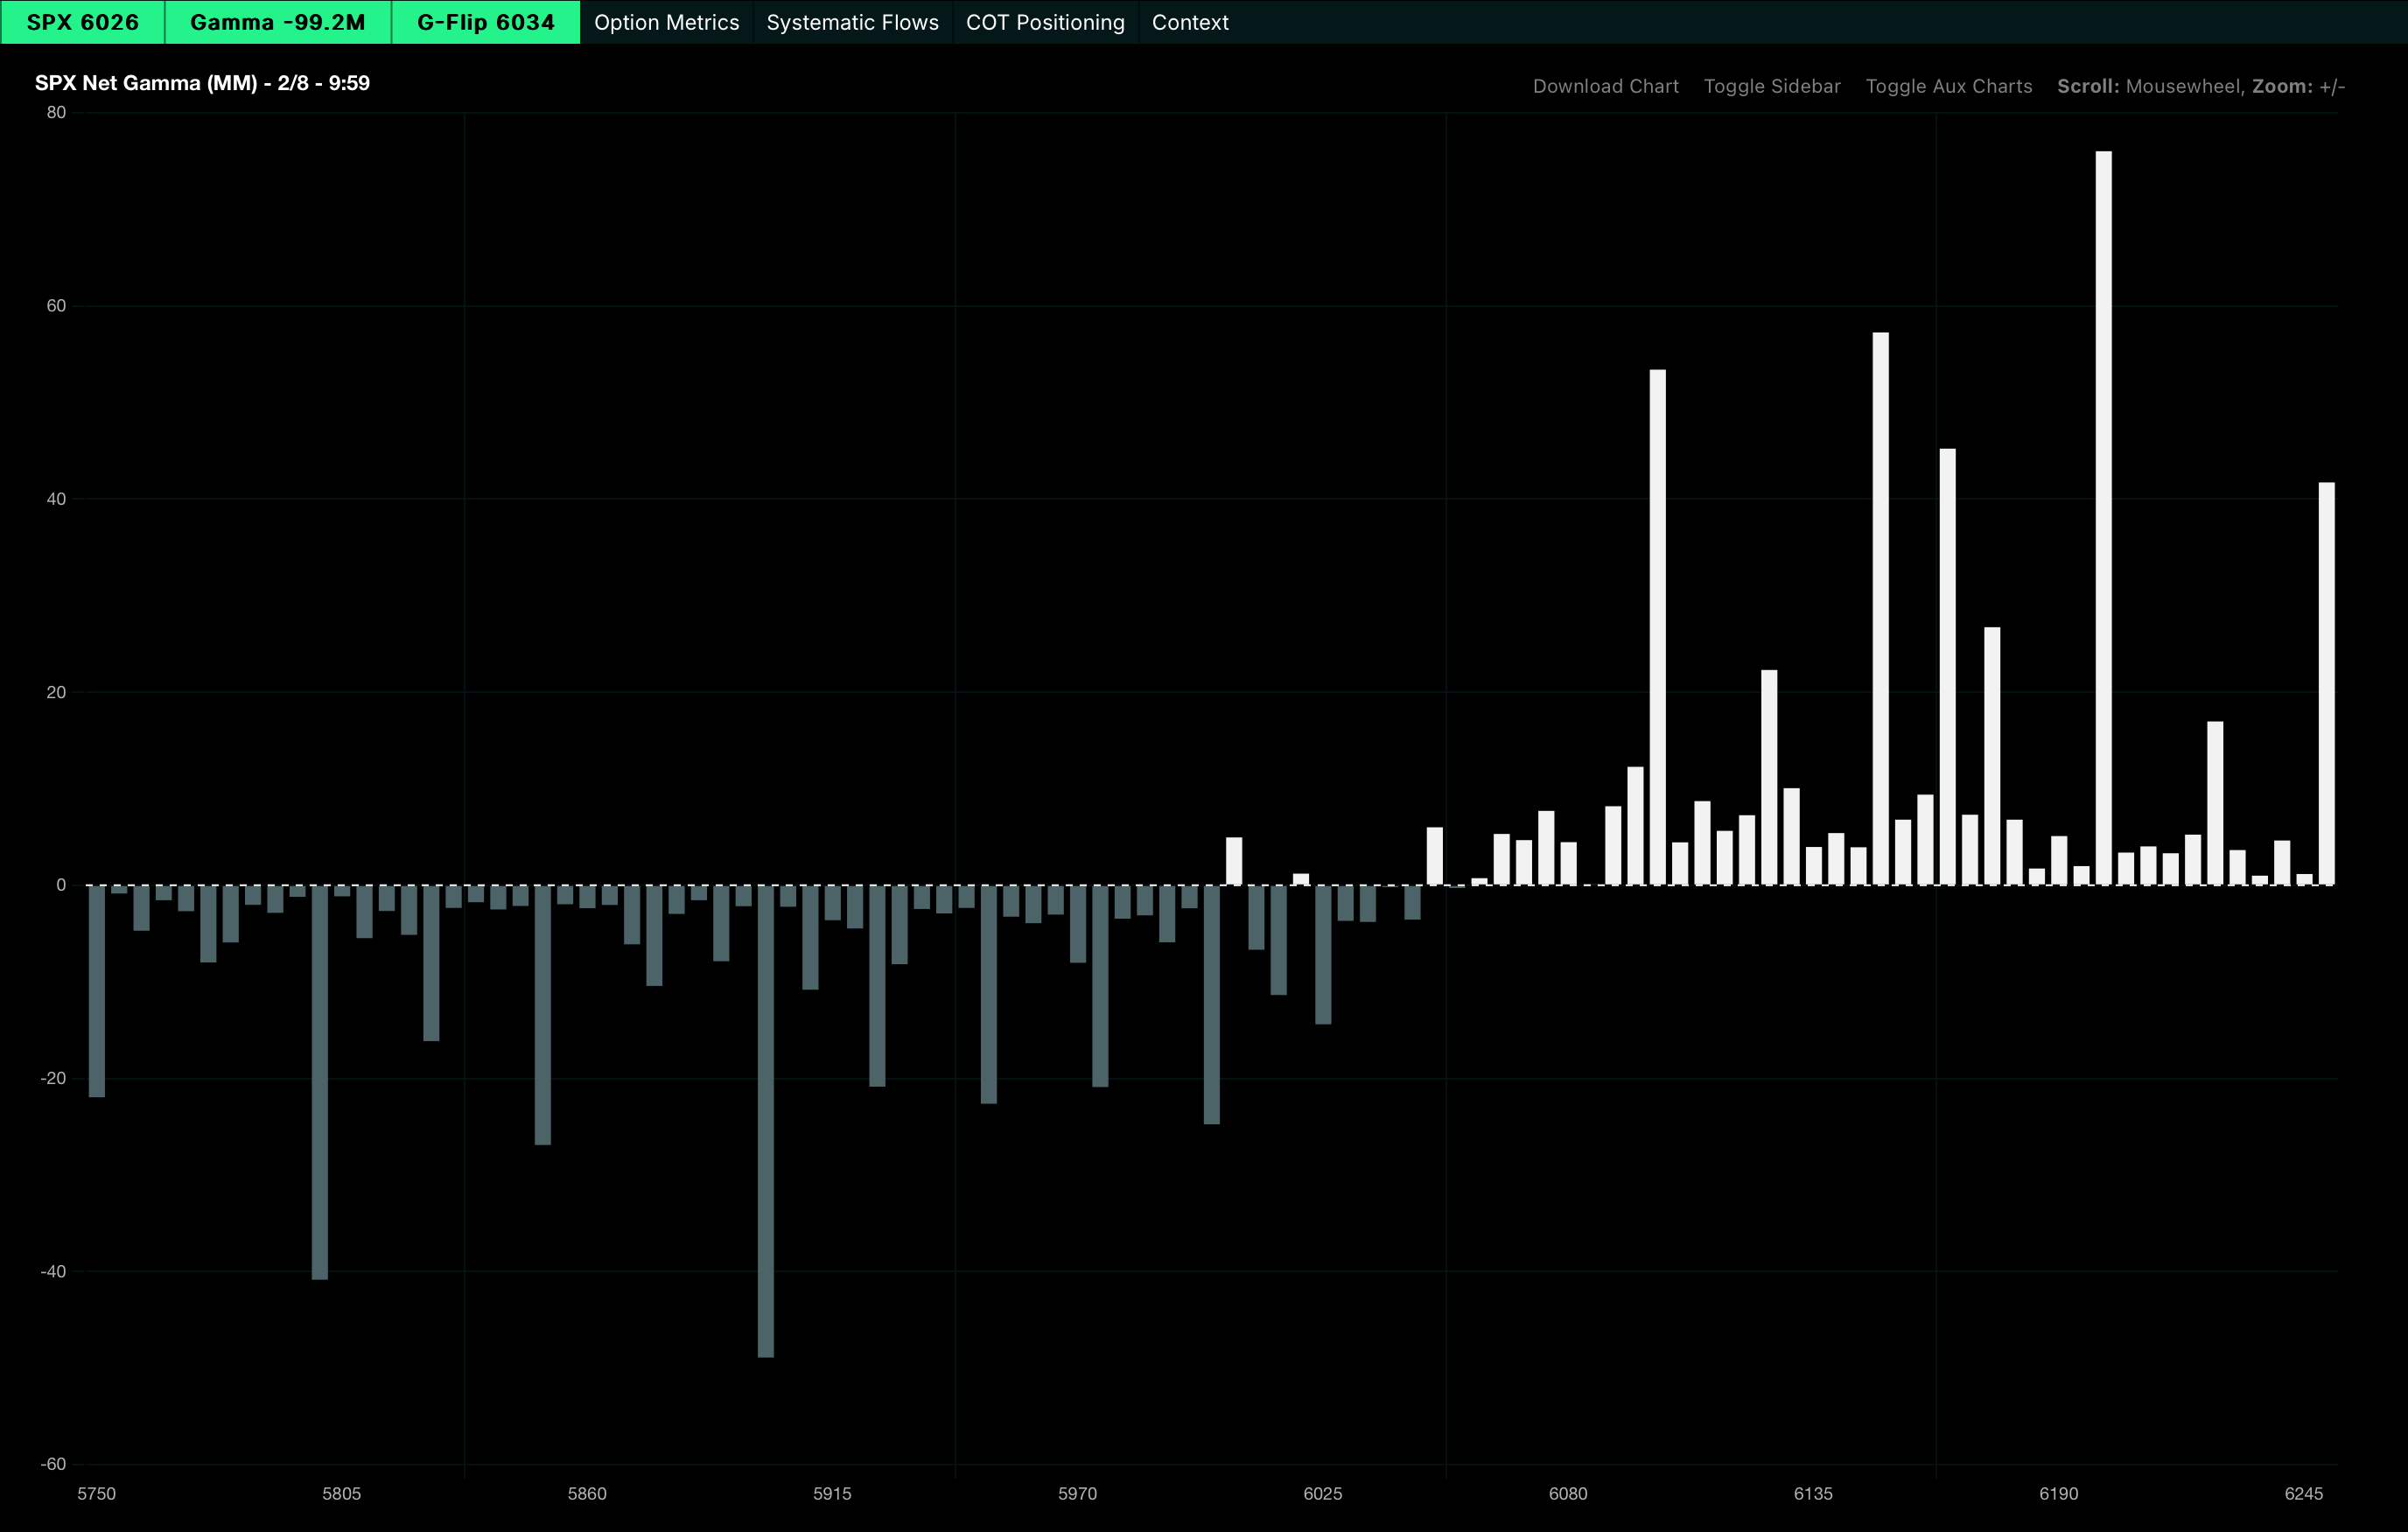
This is a chart that is showing all open interest for options activity on SPX, by far the most traded symbol on the exchanges, and breaking it down by strike… or yard line… or notches in your lover’s locket.
6200 is the largest, most dominant stack, and marks the end zone for the bulls in this picture. It’s been this way for a while now. But 6100 above us, as you can see, is heavily defended.
(We’re at 6026 right now in case you can’t read charts. I do recommend you look for love in other places if that’s the case, though)
🏈
What’s new from Friday’s tariff-laden swoon (romantic term for getting tackled) is the growth in downside stacks like 5900 and 5800. That’s to be expected after losing important yardage like that.
And there’s not a lot of open interest between 6000 and 6100. So the market will likely move towards one of those in short order on Monday, assuming the 0dte profile allows for it. (Zero-dated expiring options, i.e. same day expiration that can have an outsized effect on the day’s movement vs this overall net gamma that encompasses all expirations)
The gamma levels work like magnets, or like defensive linemen on a football field. They can attract or repel price. The larger the stack, the more powerful the magnet (or the defensive lineman).
This is another GEX chart, courtesy Tradytics (Tradytics.com), ostensibly showing the same thing, but painting a little bit of a different picture1:
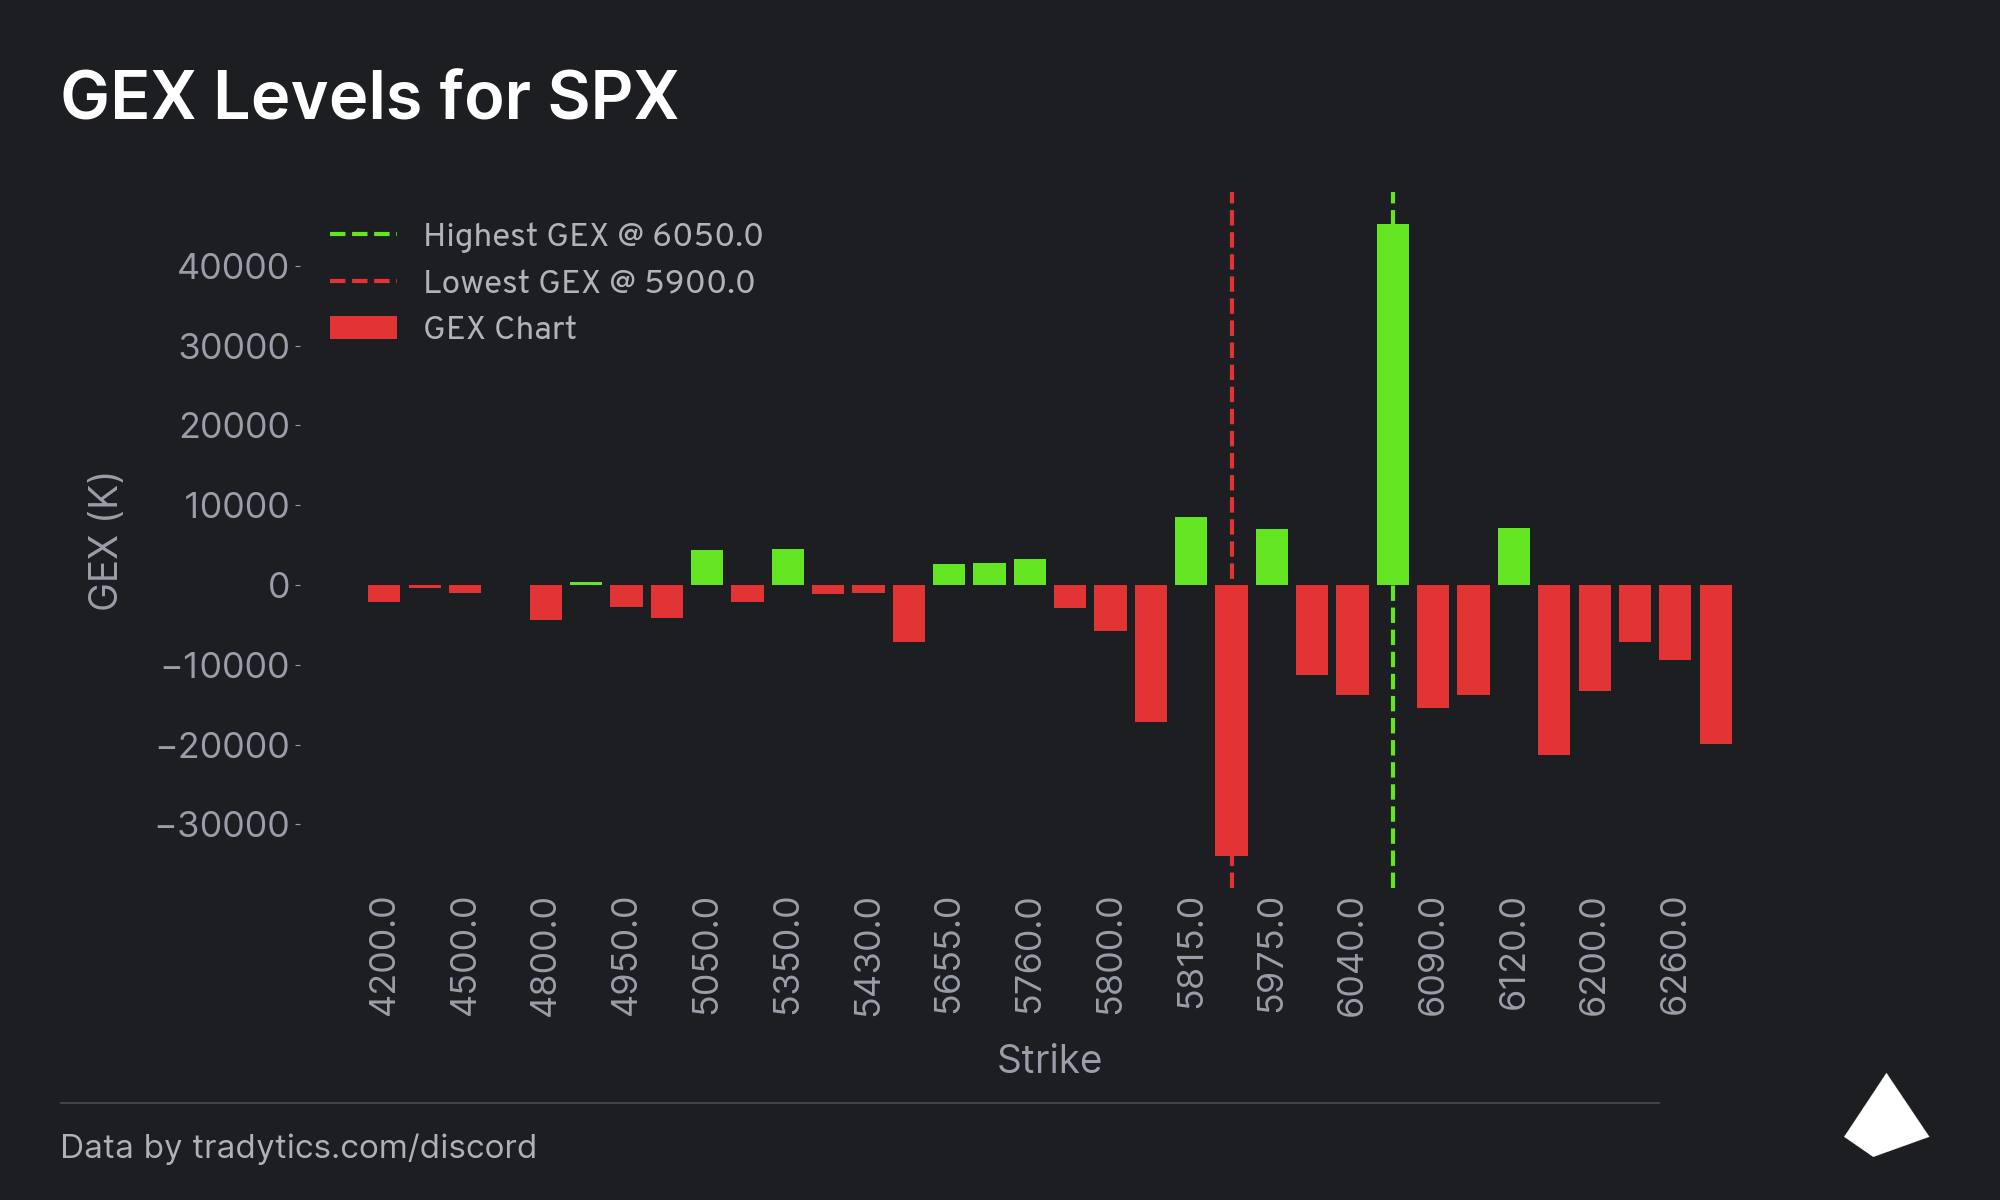
Tradytics is showing slight magnets at 6040, just above us, and another unlabeled level (the chart is not evenly numbered unfortunately), with a larger magnet down at 5900, intermediate road bump at 5975 —Interception!— and a large ceiling above us at 6050, the big green positive gamma stack, which should repel price.
(Red negative gamma attracts price and green positive gamma stacks repel price on Tradytics).
Despite their differences, both show a somewhat wide distribution range of open interest across the spectrum, with a growing number of competing large stacks that suggest the market is uncertain about where it’s going next.
And can you blame them? The Donald hasn’t even called us back about if we’re on again or off again with all those “tariffs to many countries.” But I’m sure he’ll pull through by V-Day.
It makes sense for the gamma structure to be distributed because volatility is elevated into CPI, PPI, and Fed Chair Powell’s congressional testimony next week: (Oh yeah, papi is lookin for love too!)
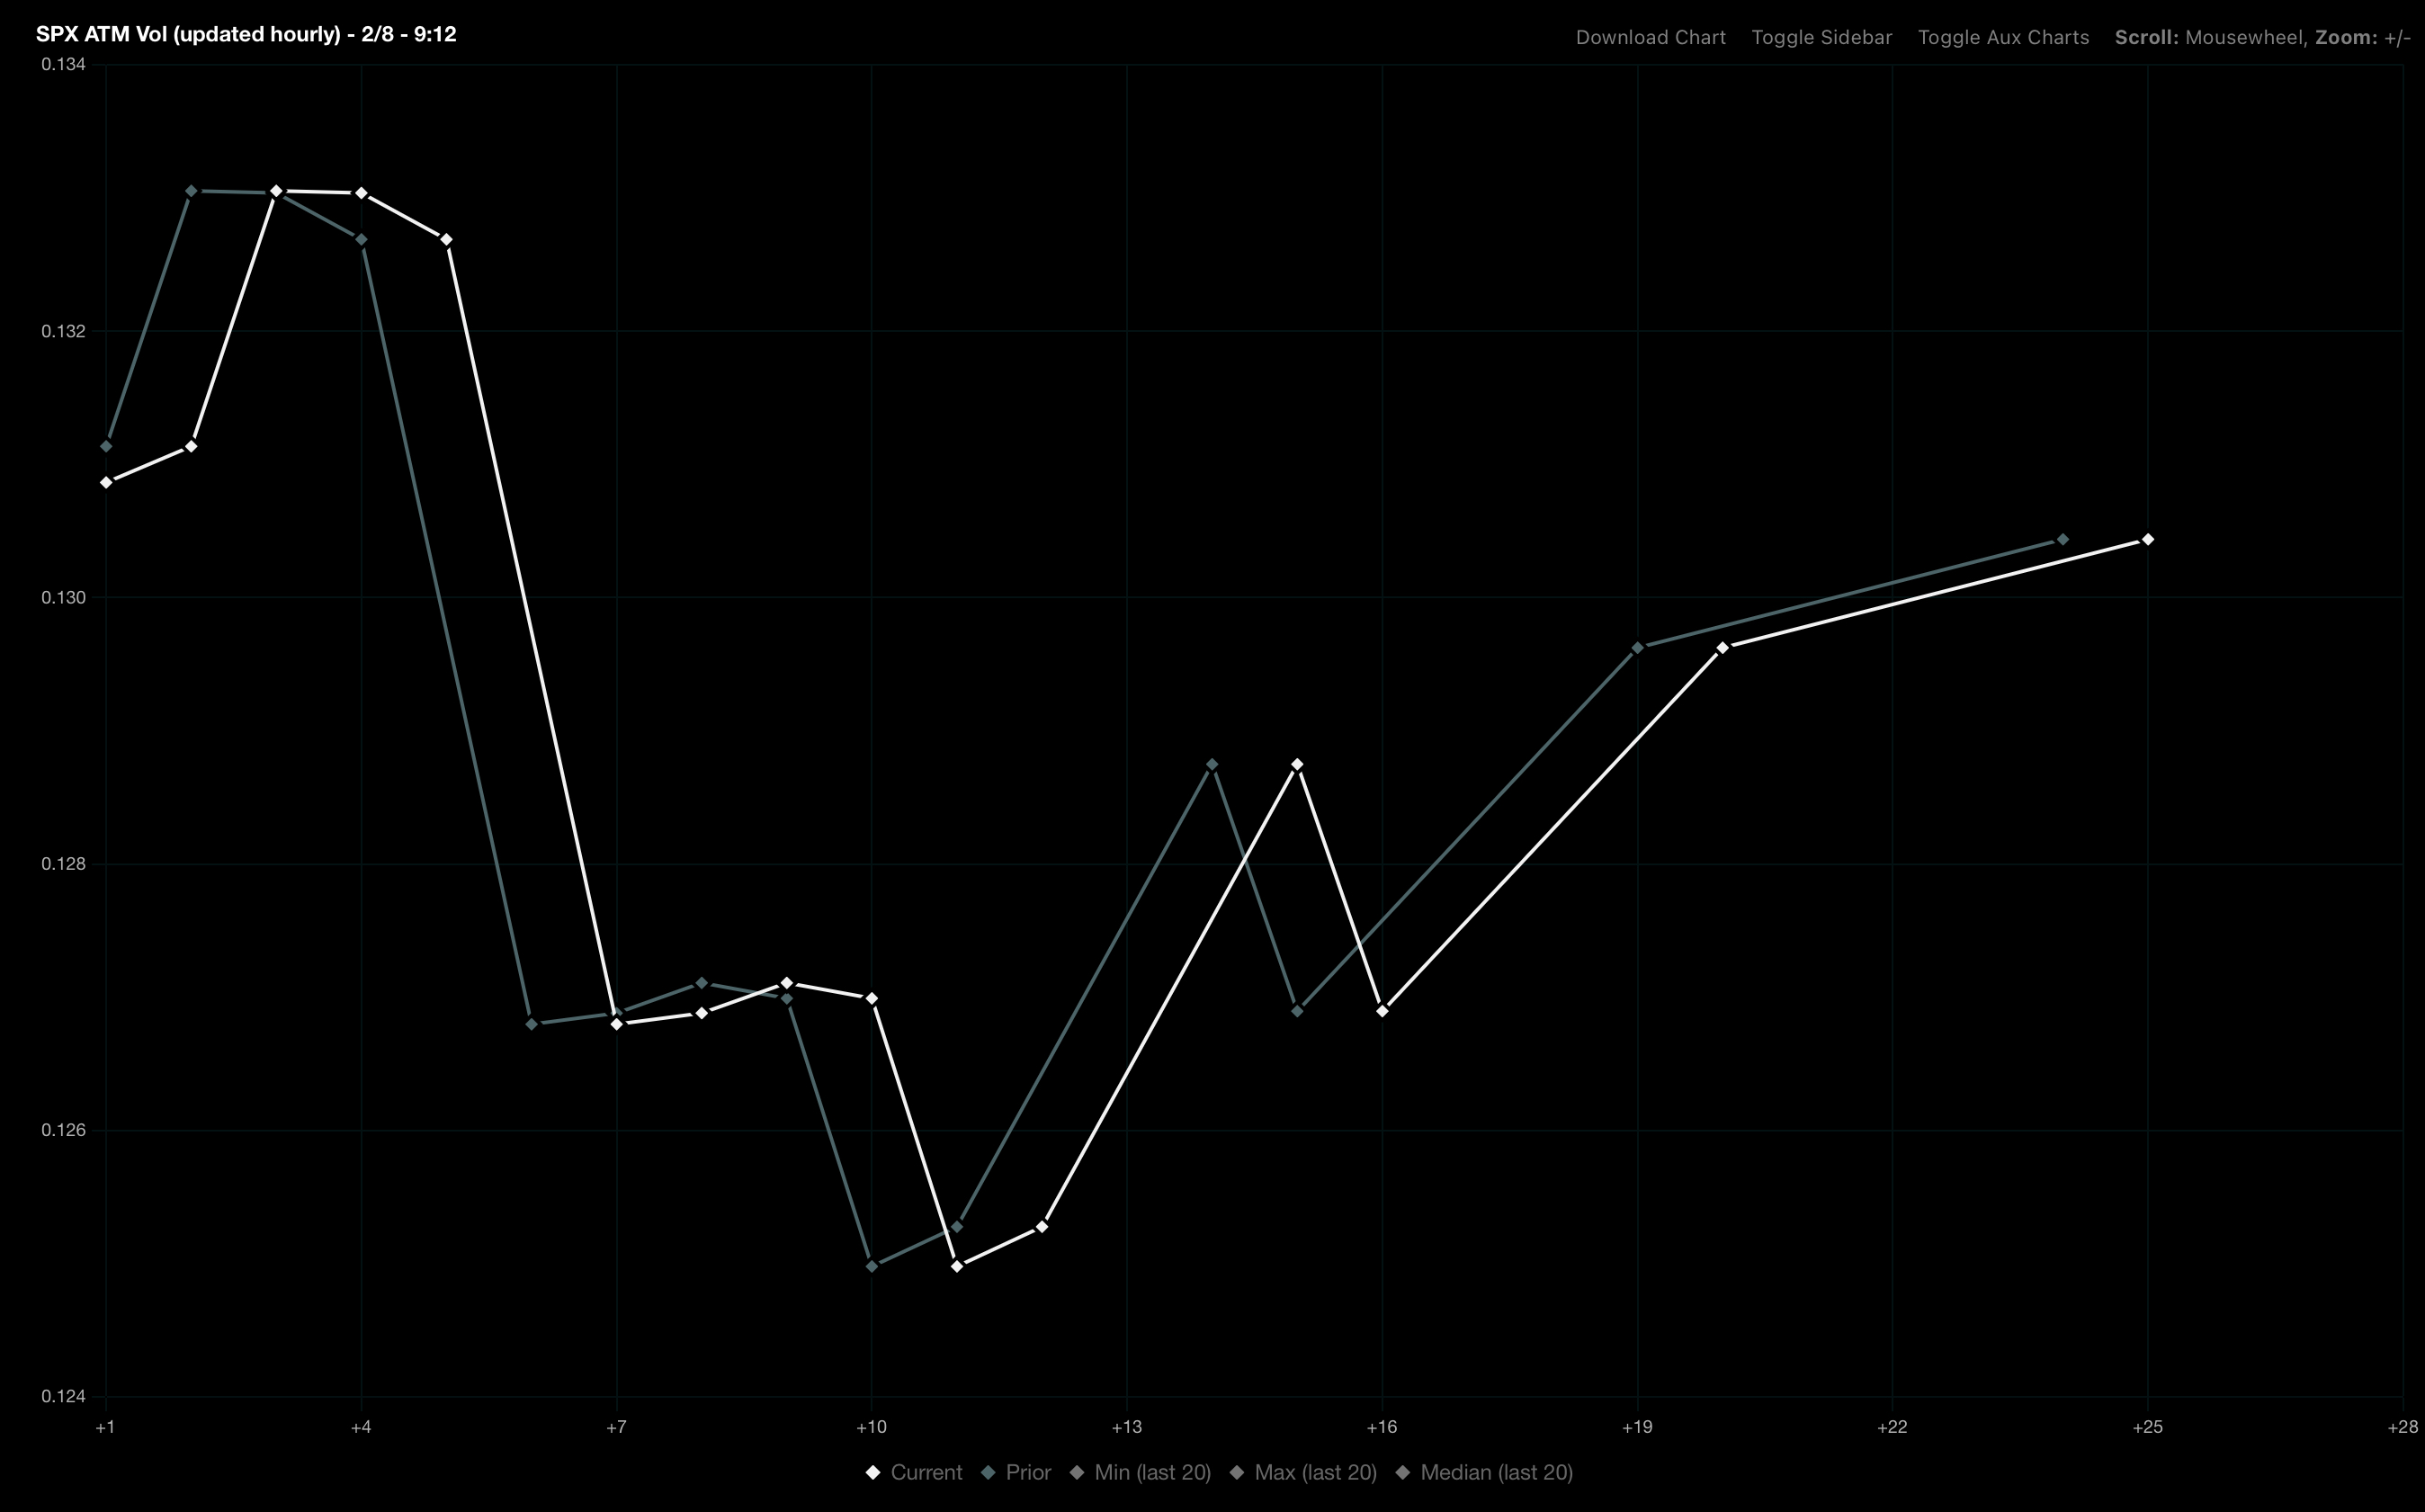
The volatility curve is telling us the market expects volatility to increase in 3 days and then after this week it will collapse precipitously (the volatility, not the market… NOT the market… this relationship was just at all time highs… we haven’t even tried counseling yet!)
The gamma distribution right now is just matching the expectation for higher volatility, like a risky play on the field, or one of those awkward moments on the date where the lights go down and you’re starting to get a little snuggled up. You know the ball is going to move somewhere. But which way and how far is unclear.
(I recommend starting at first base, but you know, this is a different game, so never hurts to go for the field goal)
When volatility collapses (if it does as expected), you’ll likely see that result in fewer large levels of interest, concentrated around one or two key levels, and probably more constrained price action again. (The D-line and O-line would form up around the new yard line).
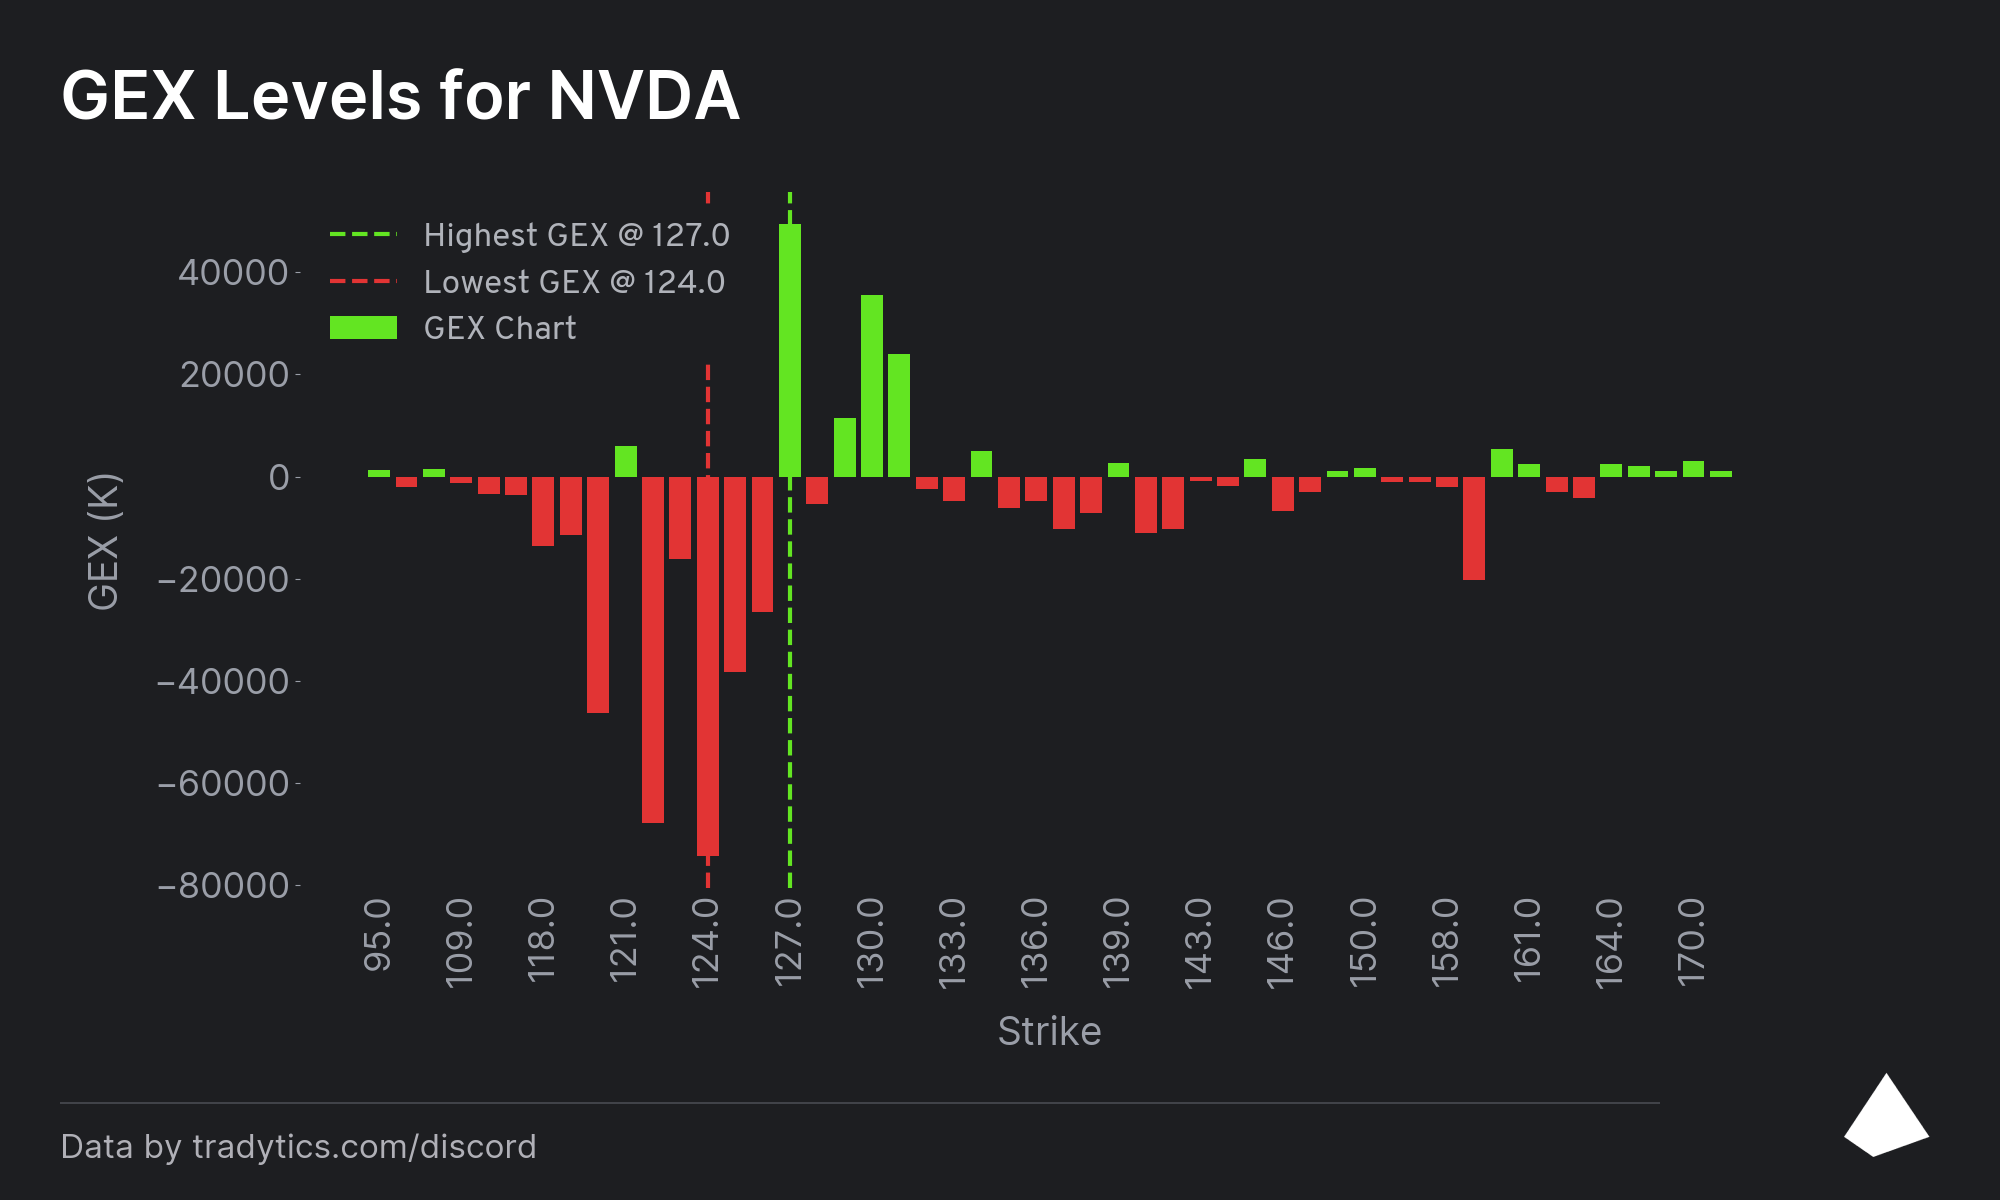
Here is an example with the current NVDA GEX. It’s a much clearer picture with a strong floor at 127, and a nice cluster of positive gamma just above us concentrated around 130 that should keep it pinned in between for the foreseeable future.
There’s large magnets below at 124 and kind of a range around it we could slip and slide around on if we were to break below the floor (127 would then become a ceiling as positive gamma stacks repel price, remember)
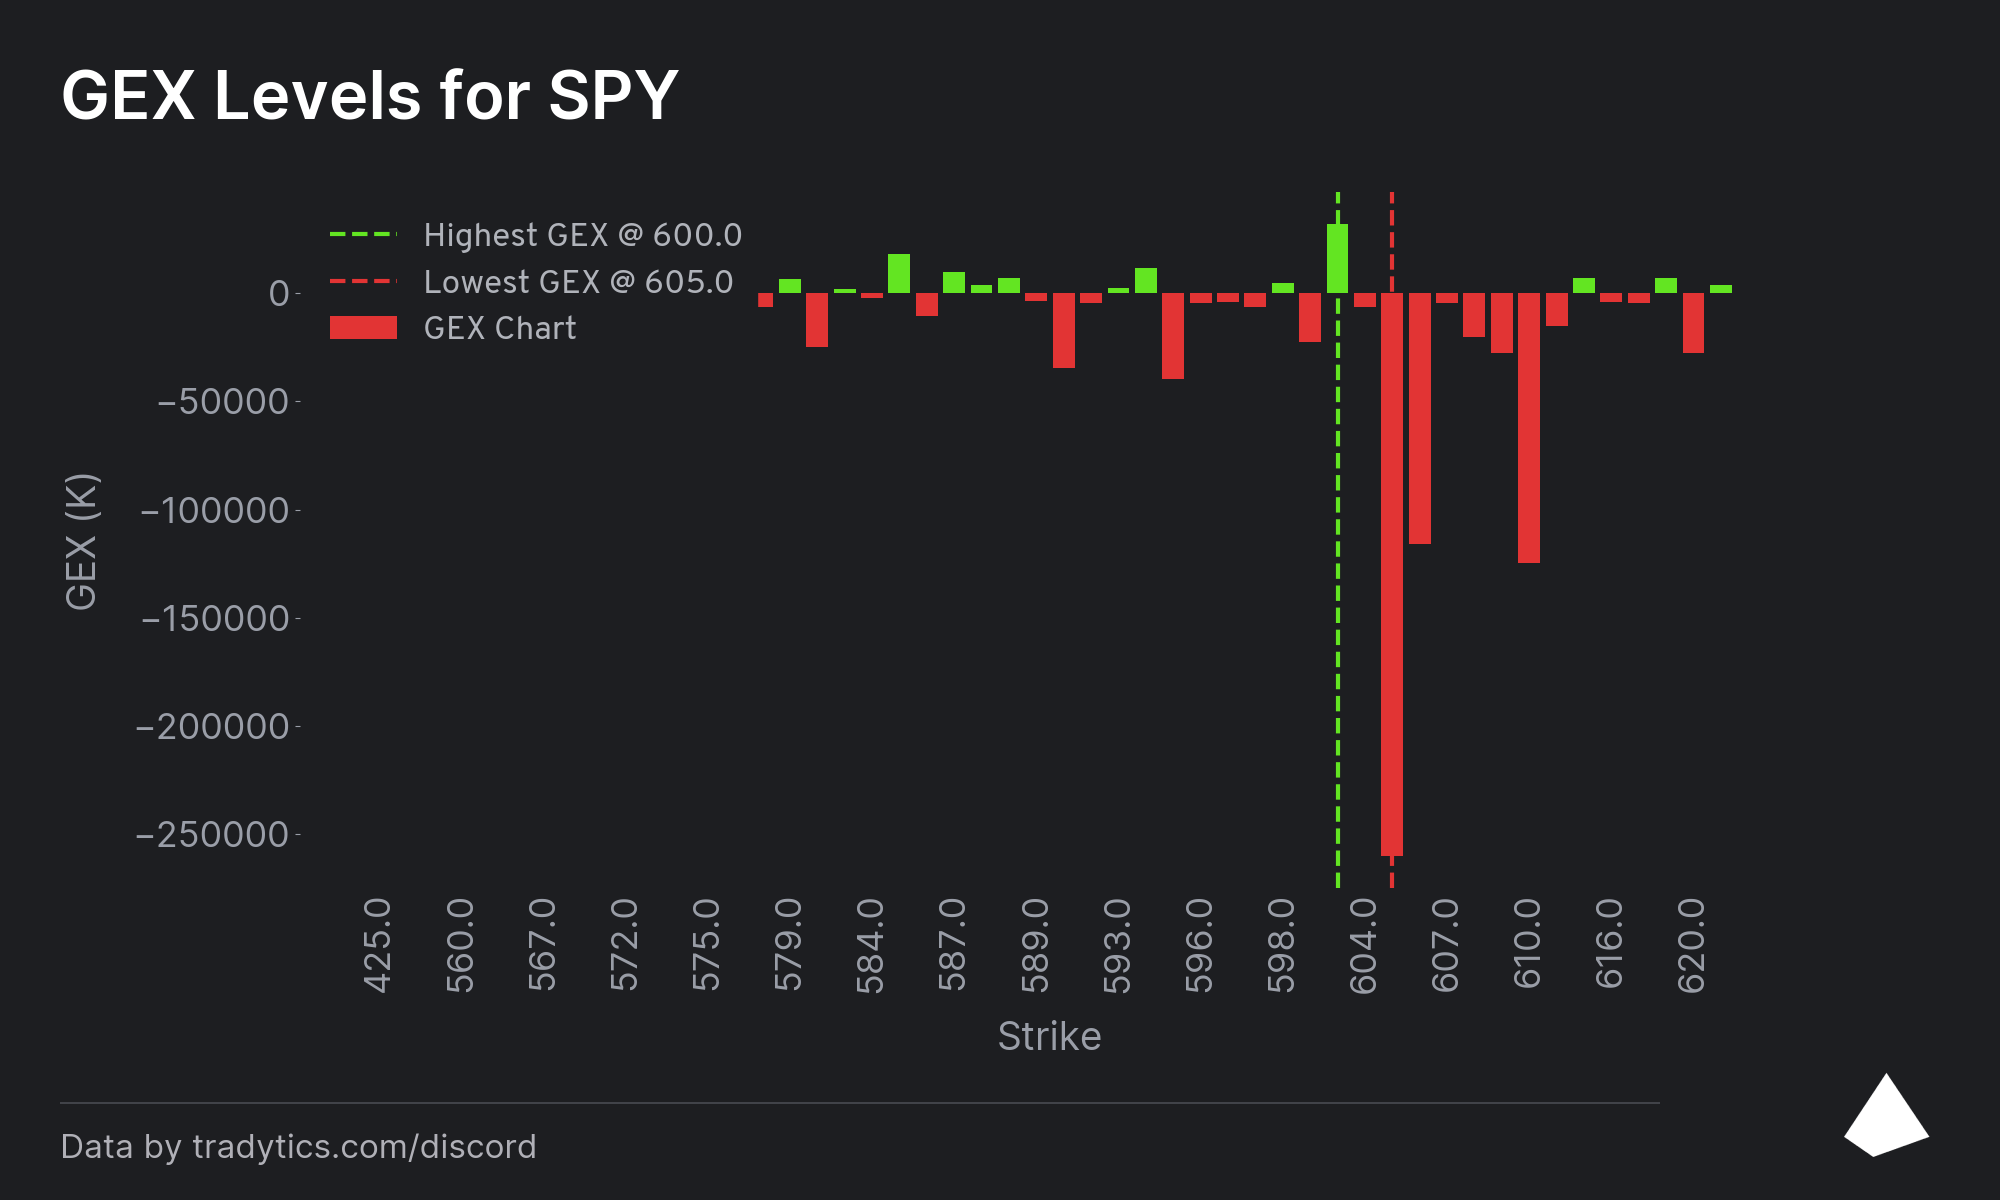
Here’s another example with SPY, which shows an interesting contrast to the SPX chart with a very dominant magnet up above us at 605 and a minor floor just below at 600.
This could create an interesting dynamic on Monday. SPX is the more traded symbol by far, so normally you would want to respect the SPX chart more. However, SPX also has more levels creating a higher resolution picture, kind of like adding the 45 yard line in between the 40 and 50. So each strike tends to be less significant unless it receives an overwhelming concentration of interest.
—Pay attention to the absolute volume on the left-hand sides of the chart. 👆
That 605 stack is very large on the SPY GEX.
There’s another relatively large stack at 610. The resistance at 6050 on the SPX gamma would need to be overcome to reach either level, but if we can, the door is wide open to hit one or both of them. (610 would be approximately 6120 on SPX)

The bottom line, or rather the play point here is that the market is setup to make big moves potentially in the near future.
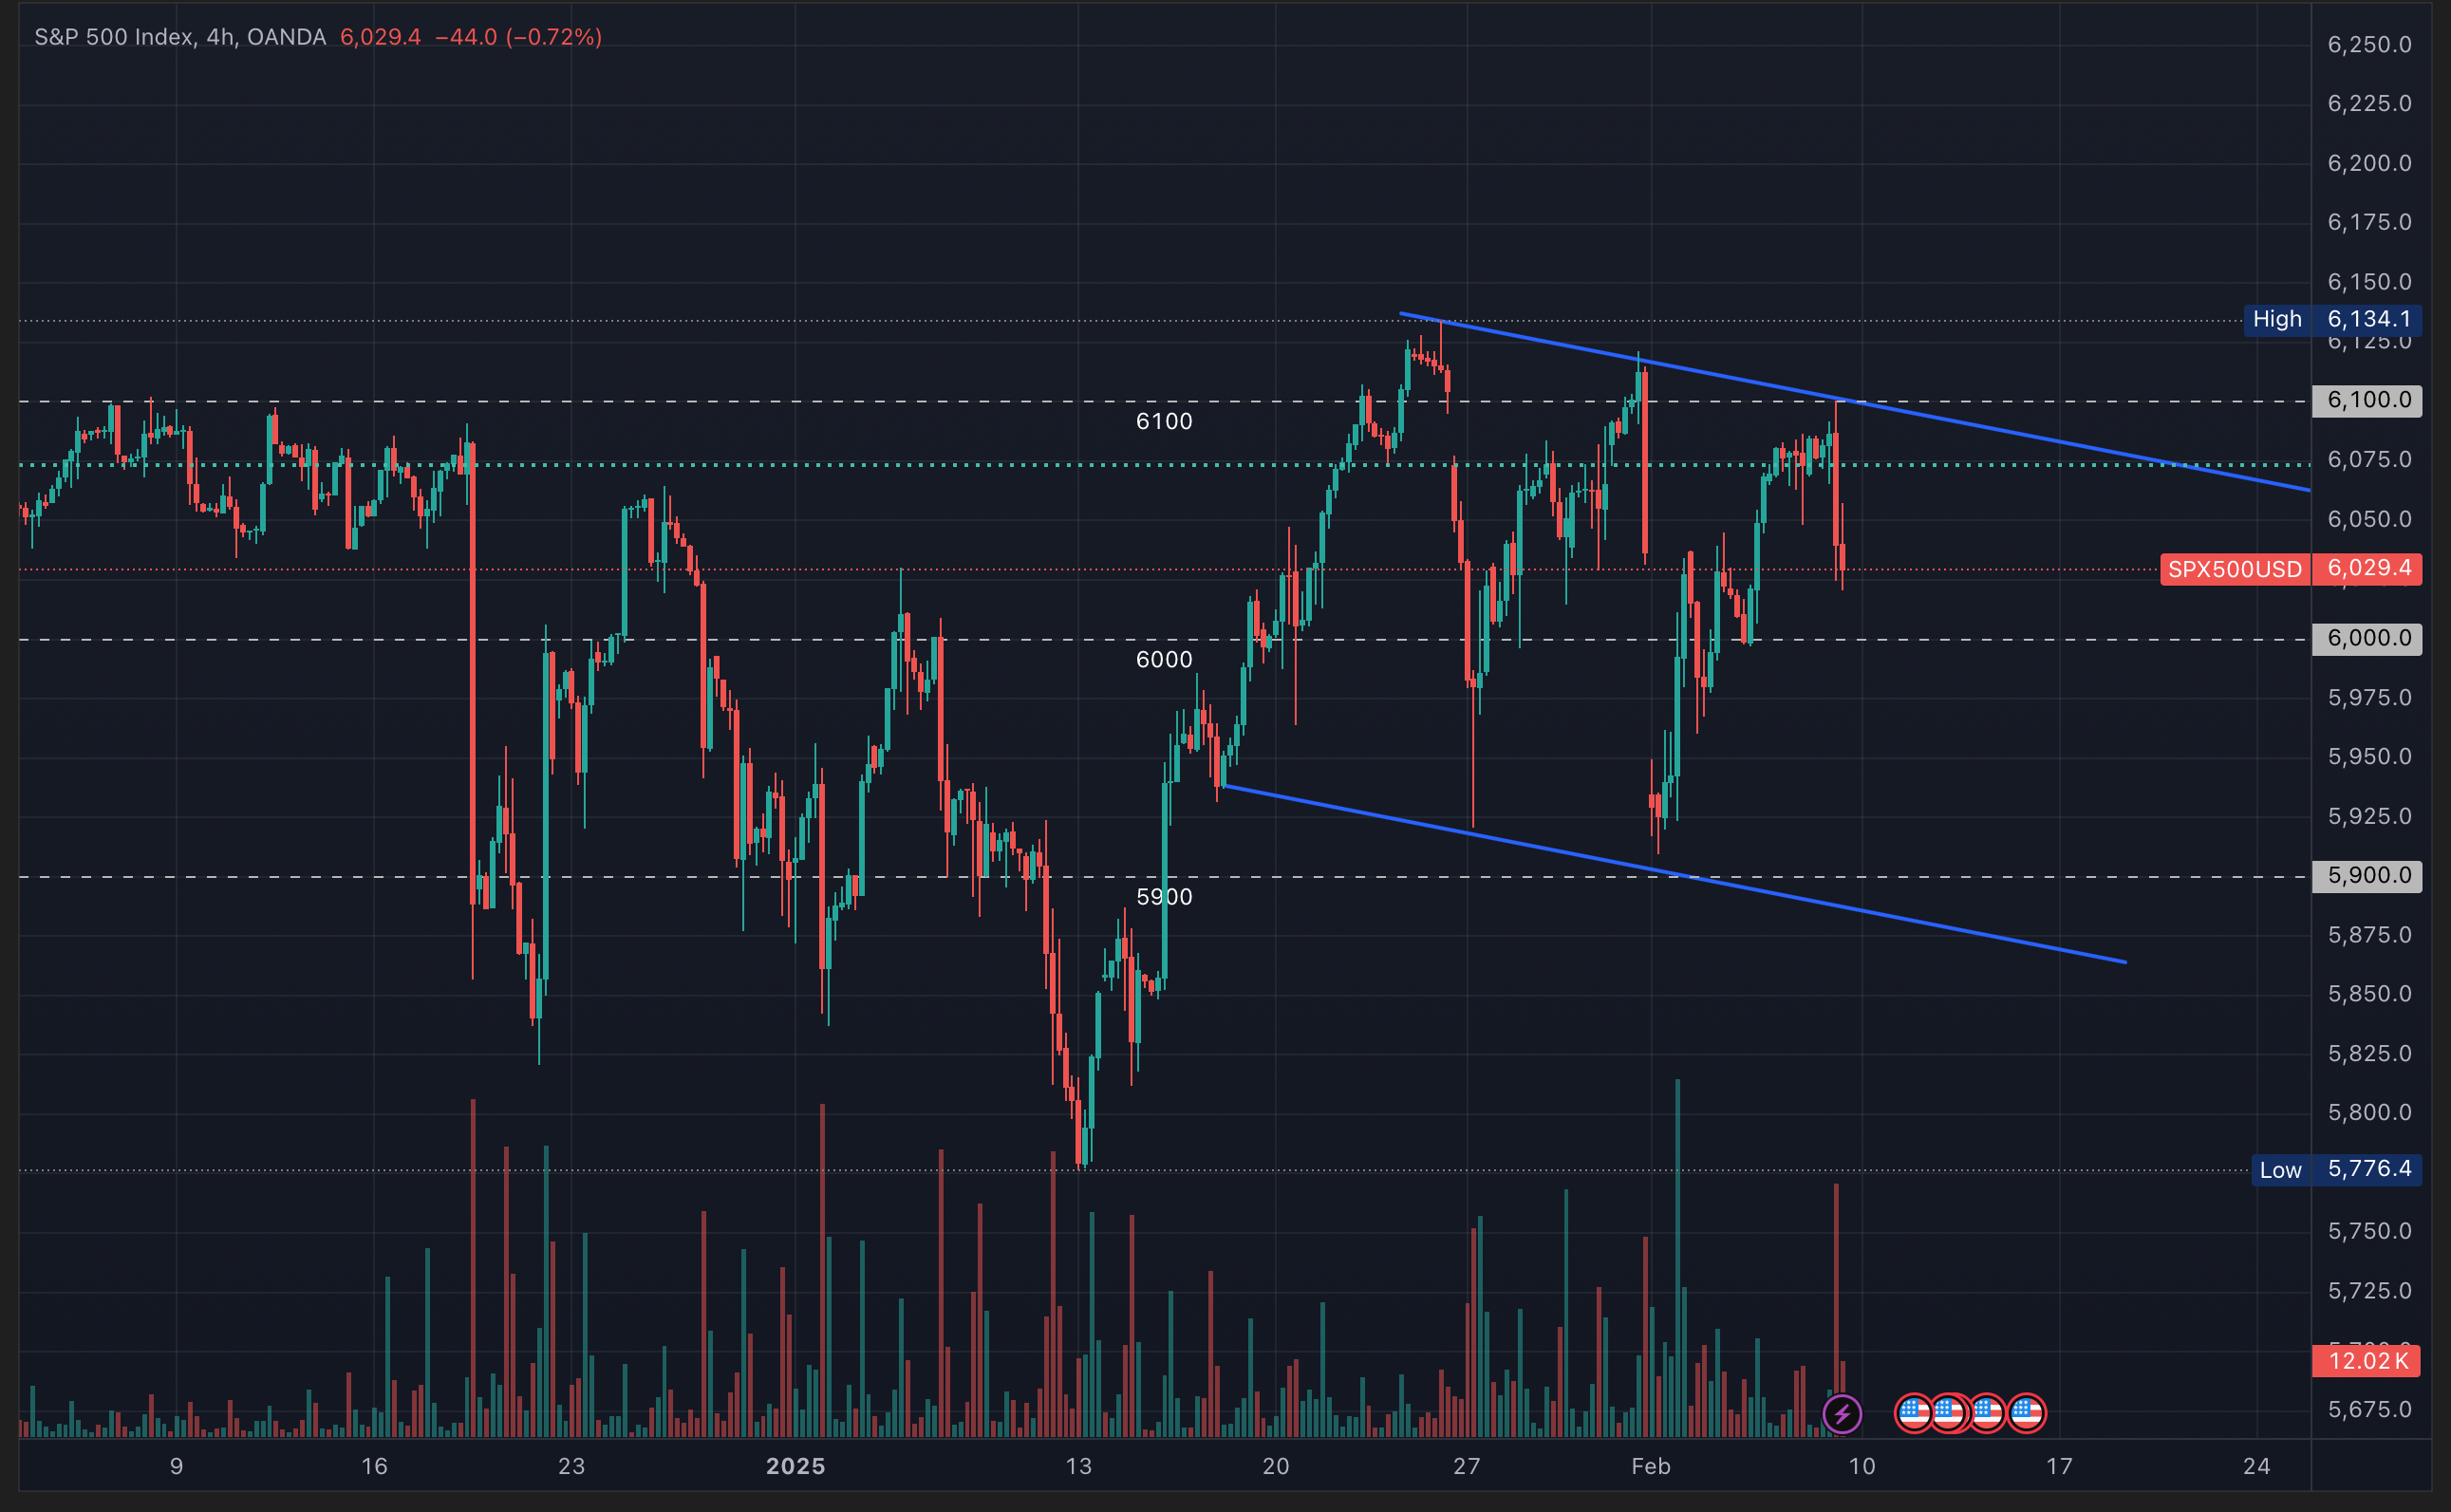
Gamma flip (the point at which things start to get more volatile underneath) is currently at 6034, essentially right at the current price. But it’s not really an exact point… 25-50 points on either side form more of a range. But given the historical significance of 6000, that’s probably a level where heavier selling would start to show up.
So yeah, a move down to 5900 is possible, as there is interest down there. There’s some moderate interest at intermediate yard lines below 6000 that might catch us intraday.
But you need to keep in mind the overall context, if you want your route running to be successful.
This pattern of selloff Friday, gap down Monday, following Mr. Trump’s schedule of foreshadowing his tariff announcements over the weekend, then rebound the rest of the week to the top of this chop range when his doting gestures are less coldly received than the market’s anxious heart had feared has been pointed out across the Fintwit horn and become fairly widely expected at this point.
Occam’s Razor says they’ll run the same play again, and that 5900 makes a lot of sense. But any good tight end knows it’s dangerous to expect a third success at the same play. You can only buy her roses so many weekends in a row before the romance starts to wane.
Having seen this pattern, it wouldn’t be too surprising if the market was simply playing defense Friday to try and get ahead of the move. A clever tight end should be prepared for a move up to 6120, or be ready to play an interception at 6000 and act accordingly.
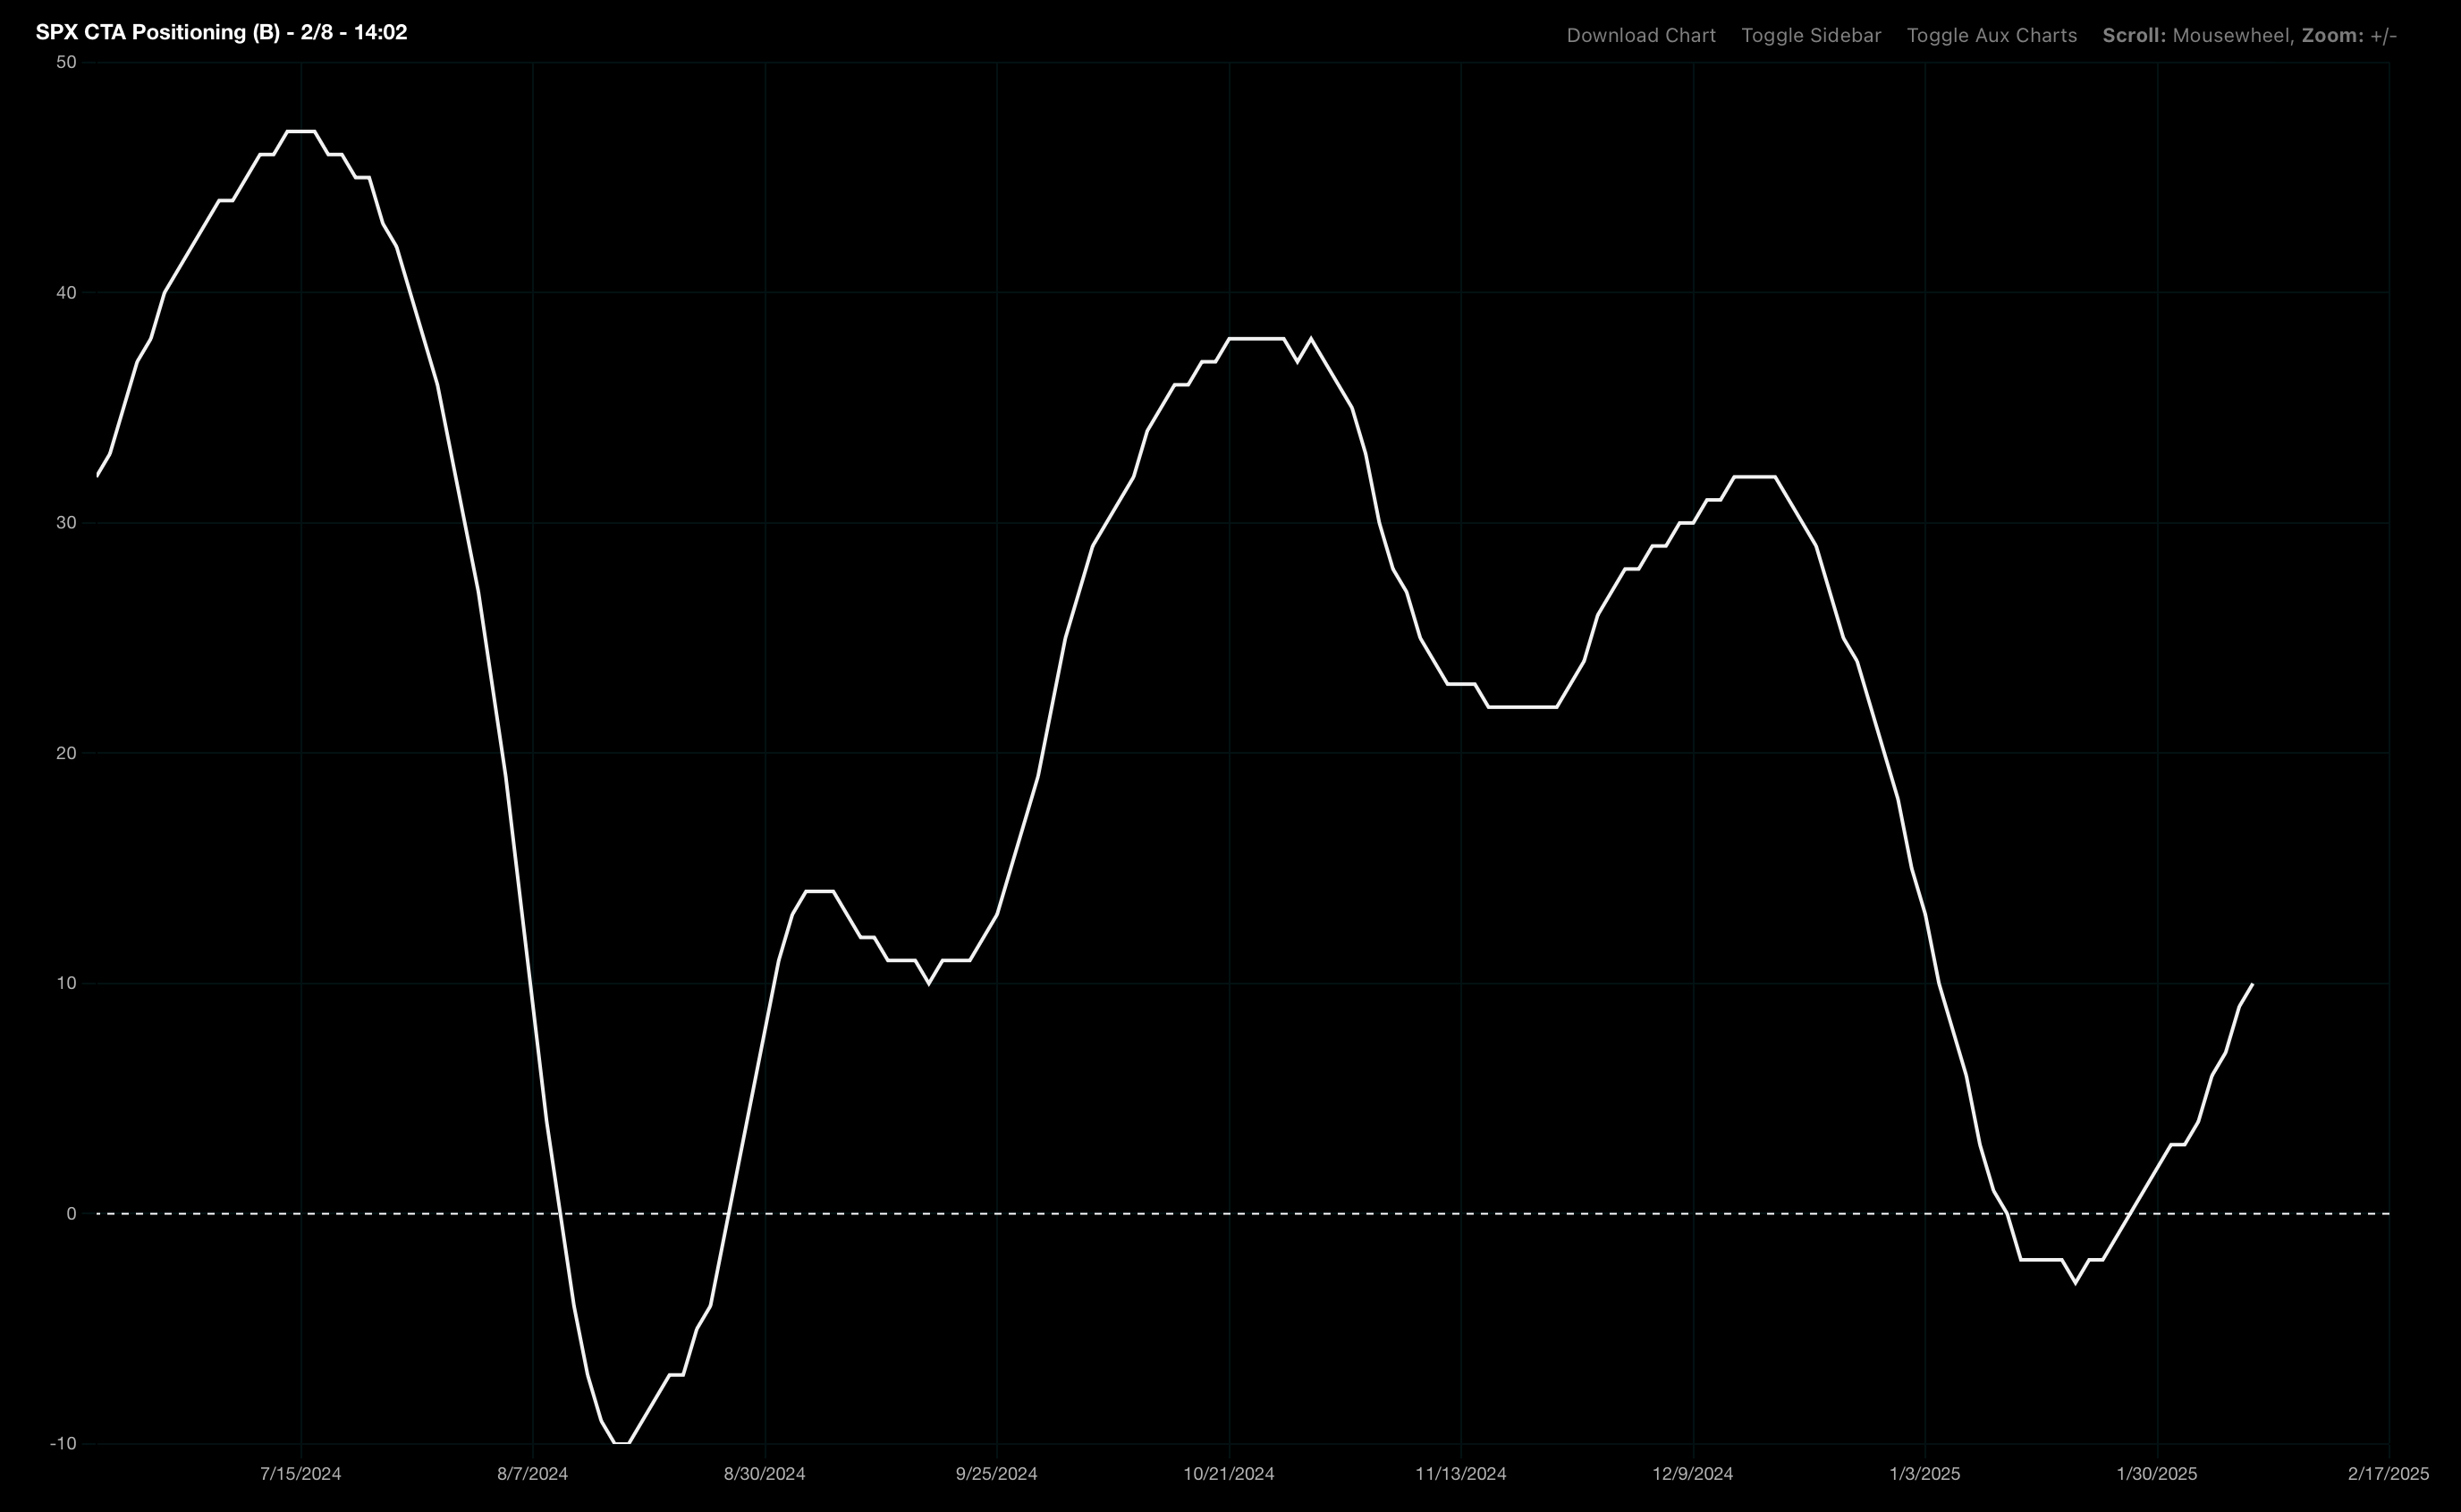
We know CTAs (big guns) started buying from low levels on the previous swoon (note that large volume at the prior low on the SPX chart above).
We know vol control funds are buying (while volatility is low).
And we definitely know retail is buying the dip, given the all time record they made the other day finally surpassing the record from March 2020 after the COVID crash.
Bears will point to the seasonal weakness due to start this week, but that only picks up later in the month in post-election years.
TL:DR:

Ultimately, if you want to impress your SO on the big day you’ll need to think on your feet like a great tight end.
The data is very clear. The market is worried about the events this week (Tariffgate, CPI, Powell’s 2-day Congressional Testimony concluding Wednesday, PPI and jobless claims Thursday) And the gamma picture is reflecting that uncertainty with the possibility of big movement and a wide distributional range with linemen spread out across the field.
If you want to run successful routes to get that touchdown you gotta be alert, adapt to the changing gamma dynamics, and keep your eye on the ball. Look alive for tariff lovebombs, tackles, and cockblocks from your peripheral vision. If you know how to read the GEX chart well, you’ll be able to find the end zone of your lover’s heart no matter how chaotic or challenging the field may look.
And to help you out I’m gifting you a full assortment of expected chocolates for the week ahead with nearly 400 stock varieties to choose from in a tactically romantic PDF format:
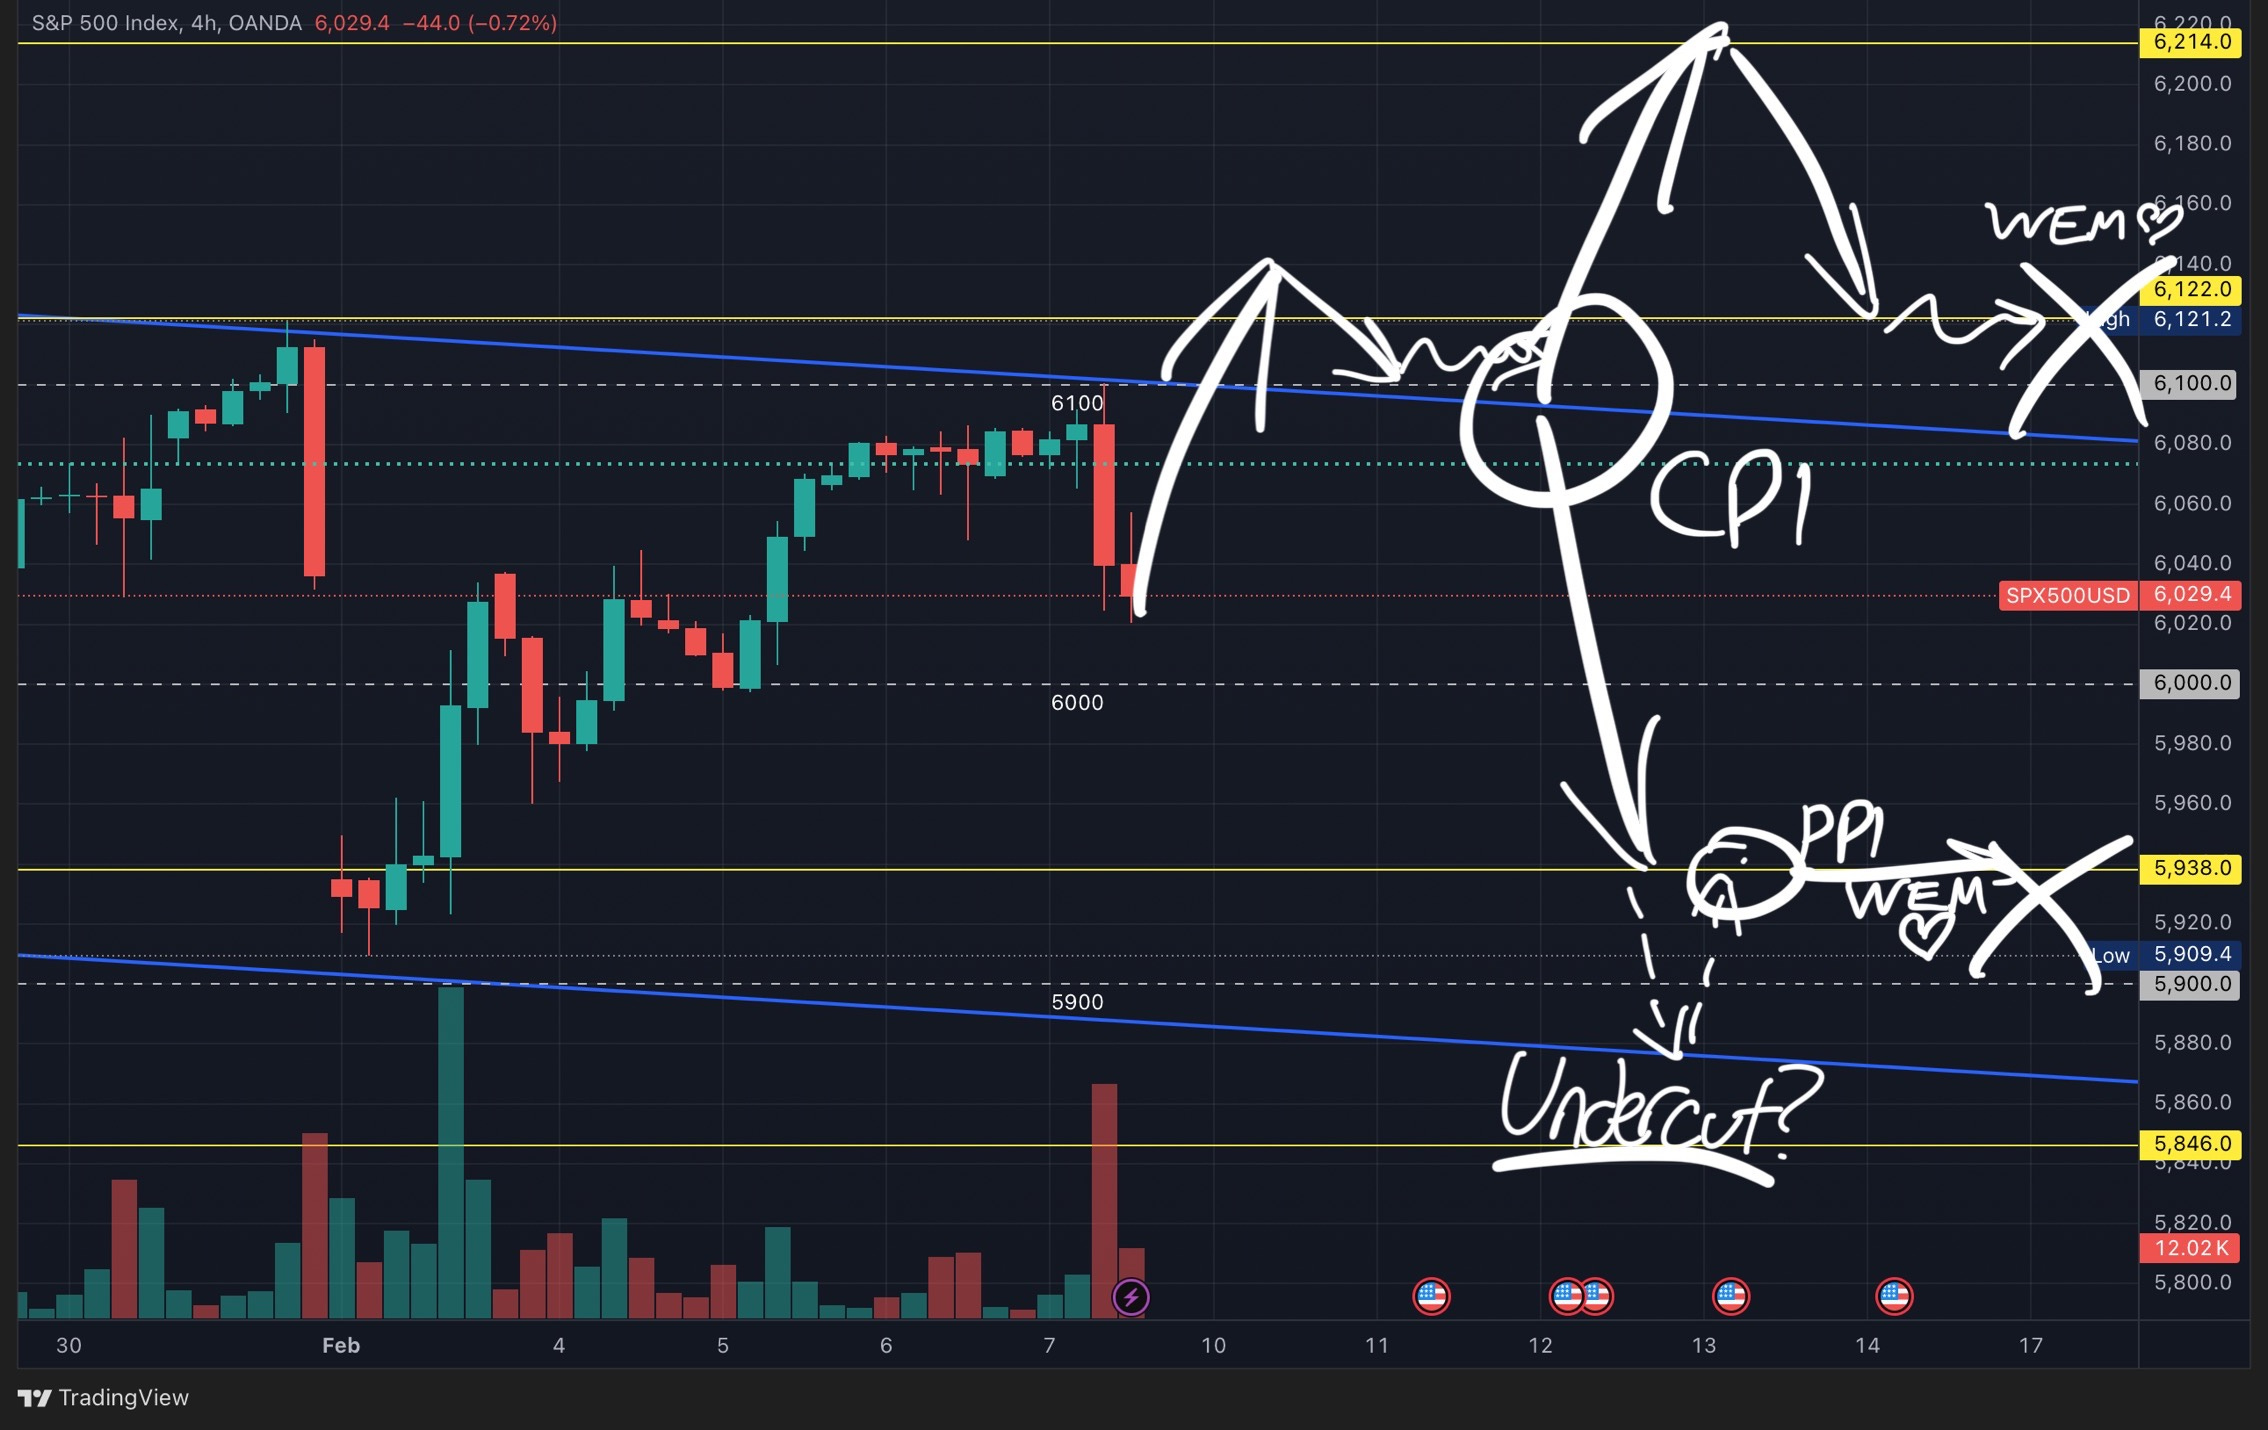
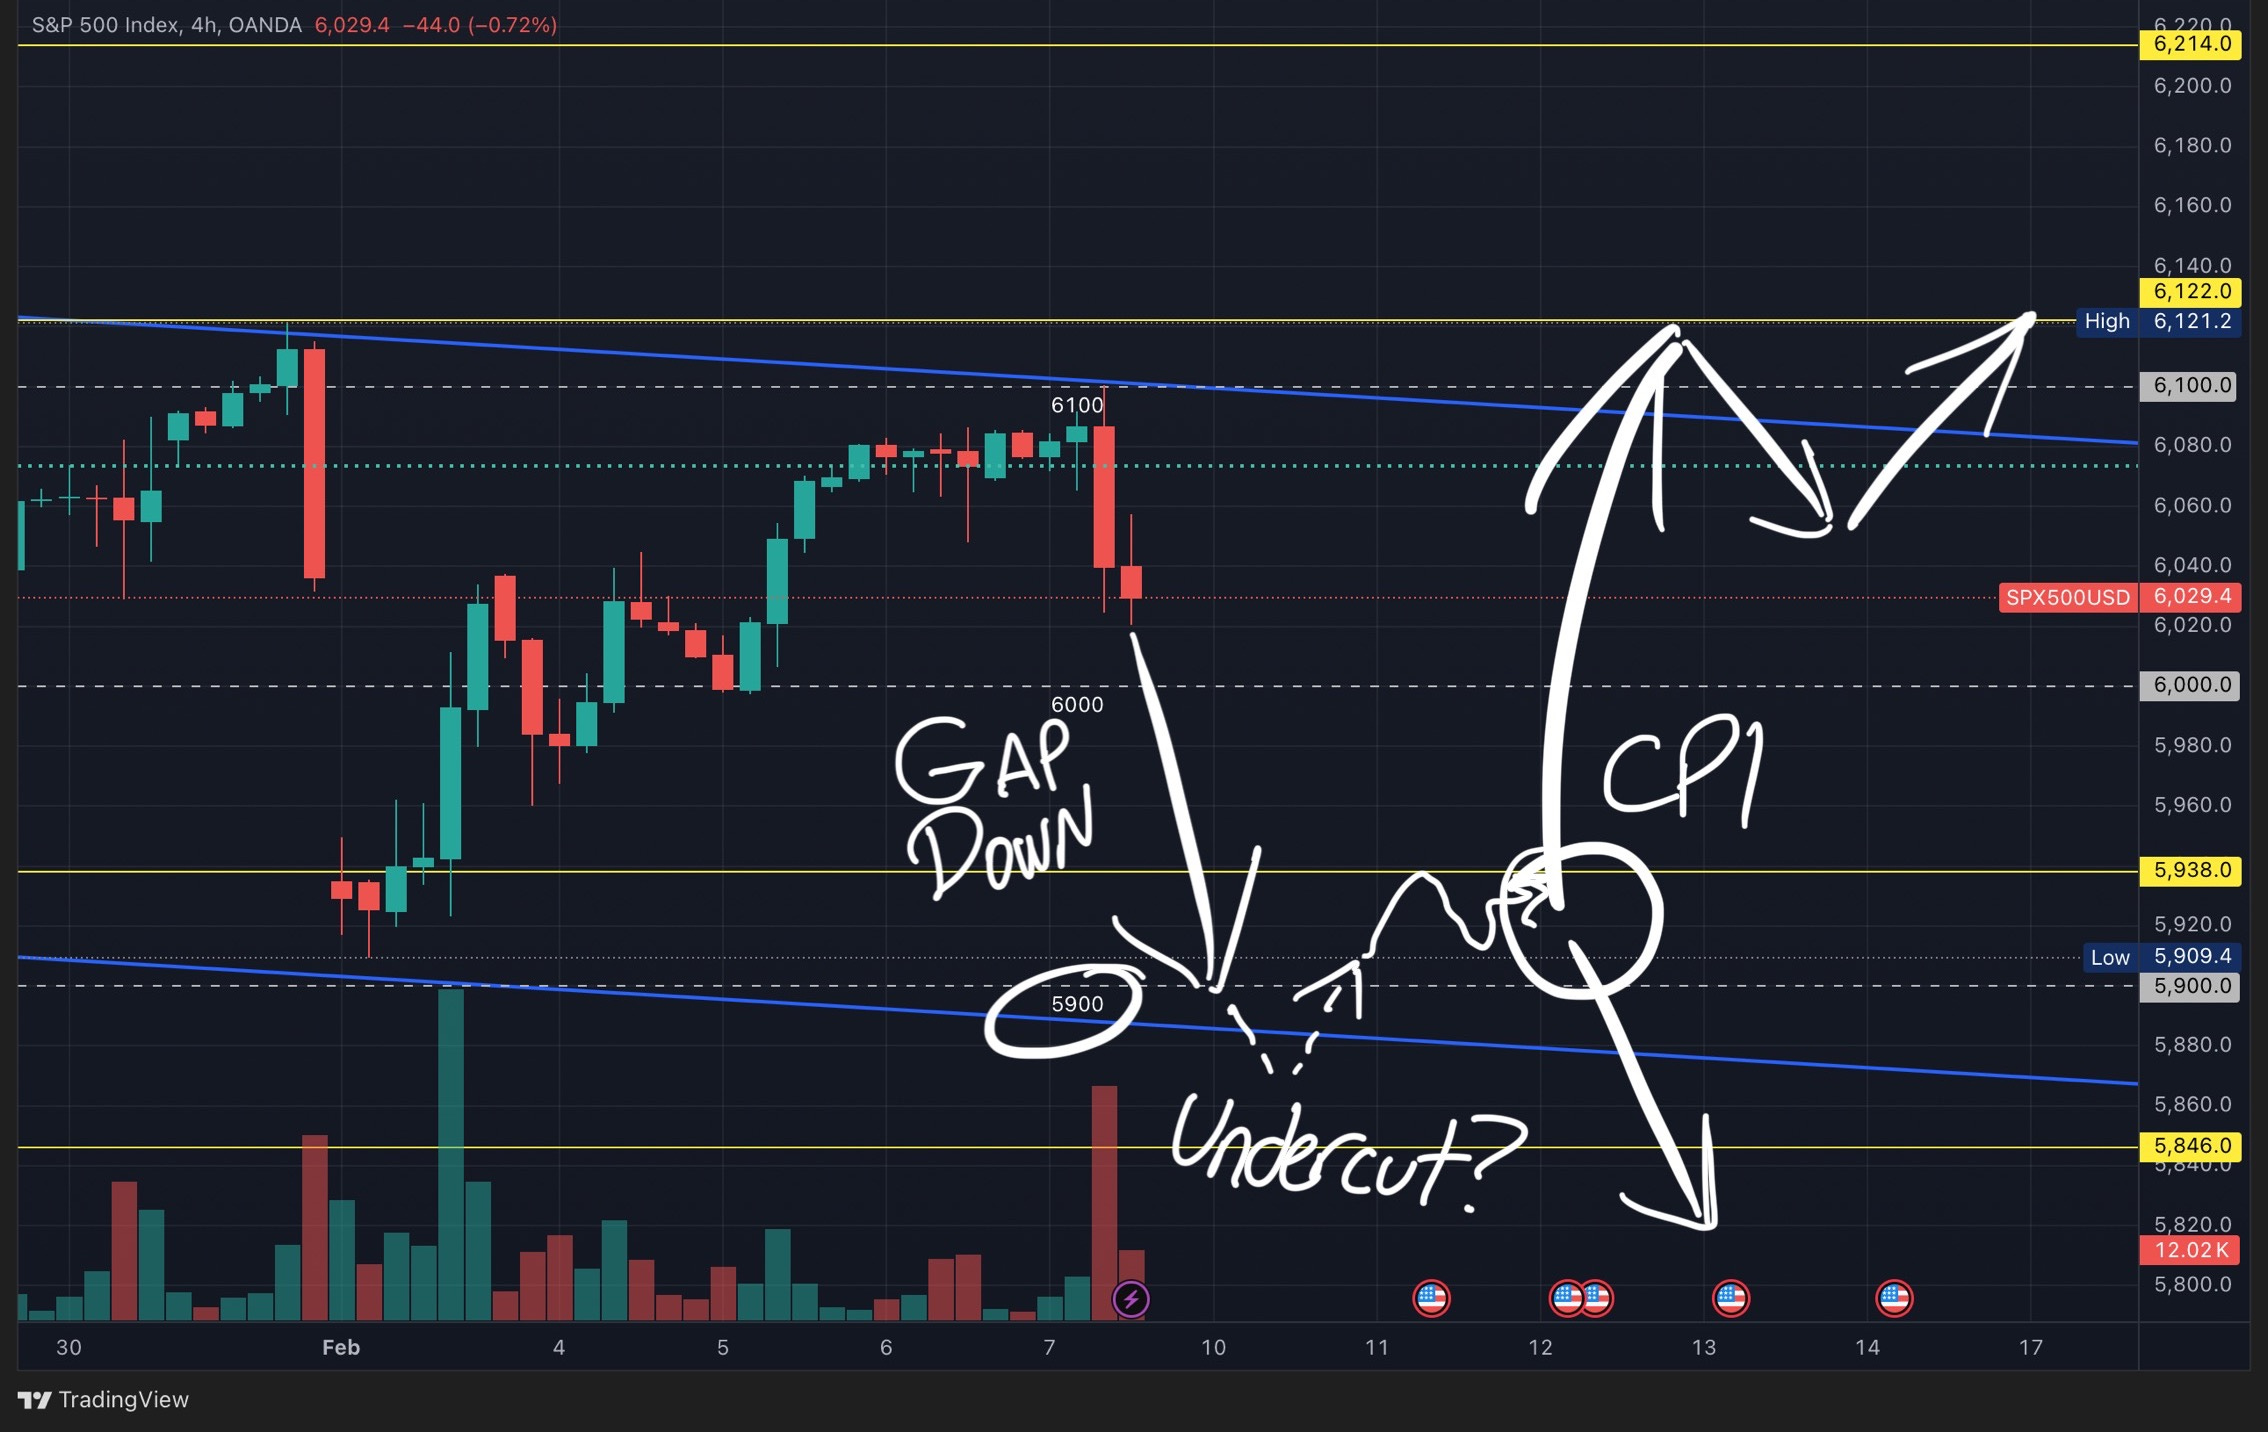
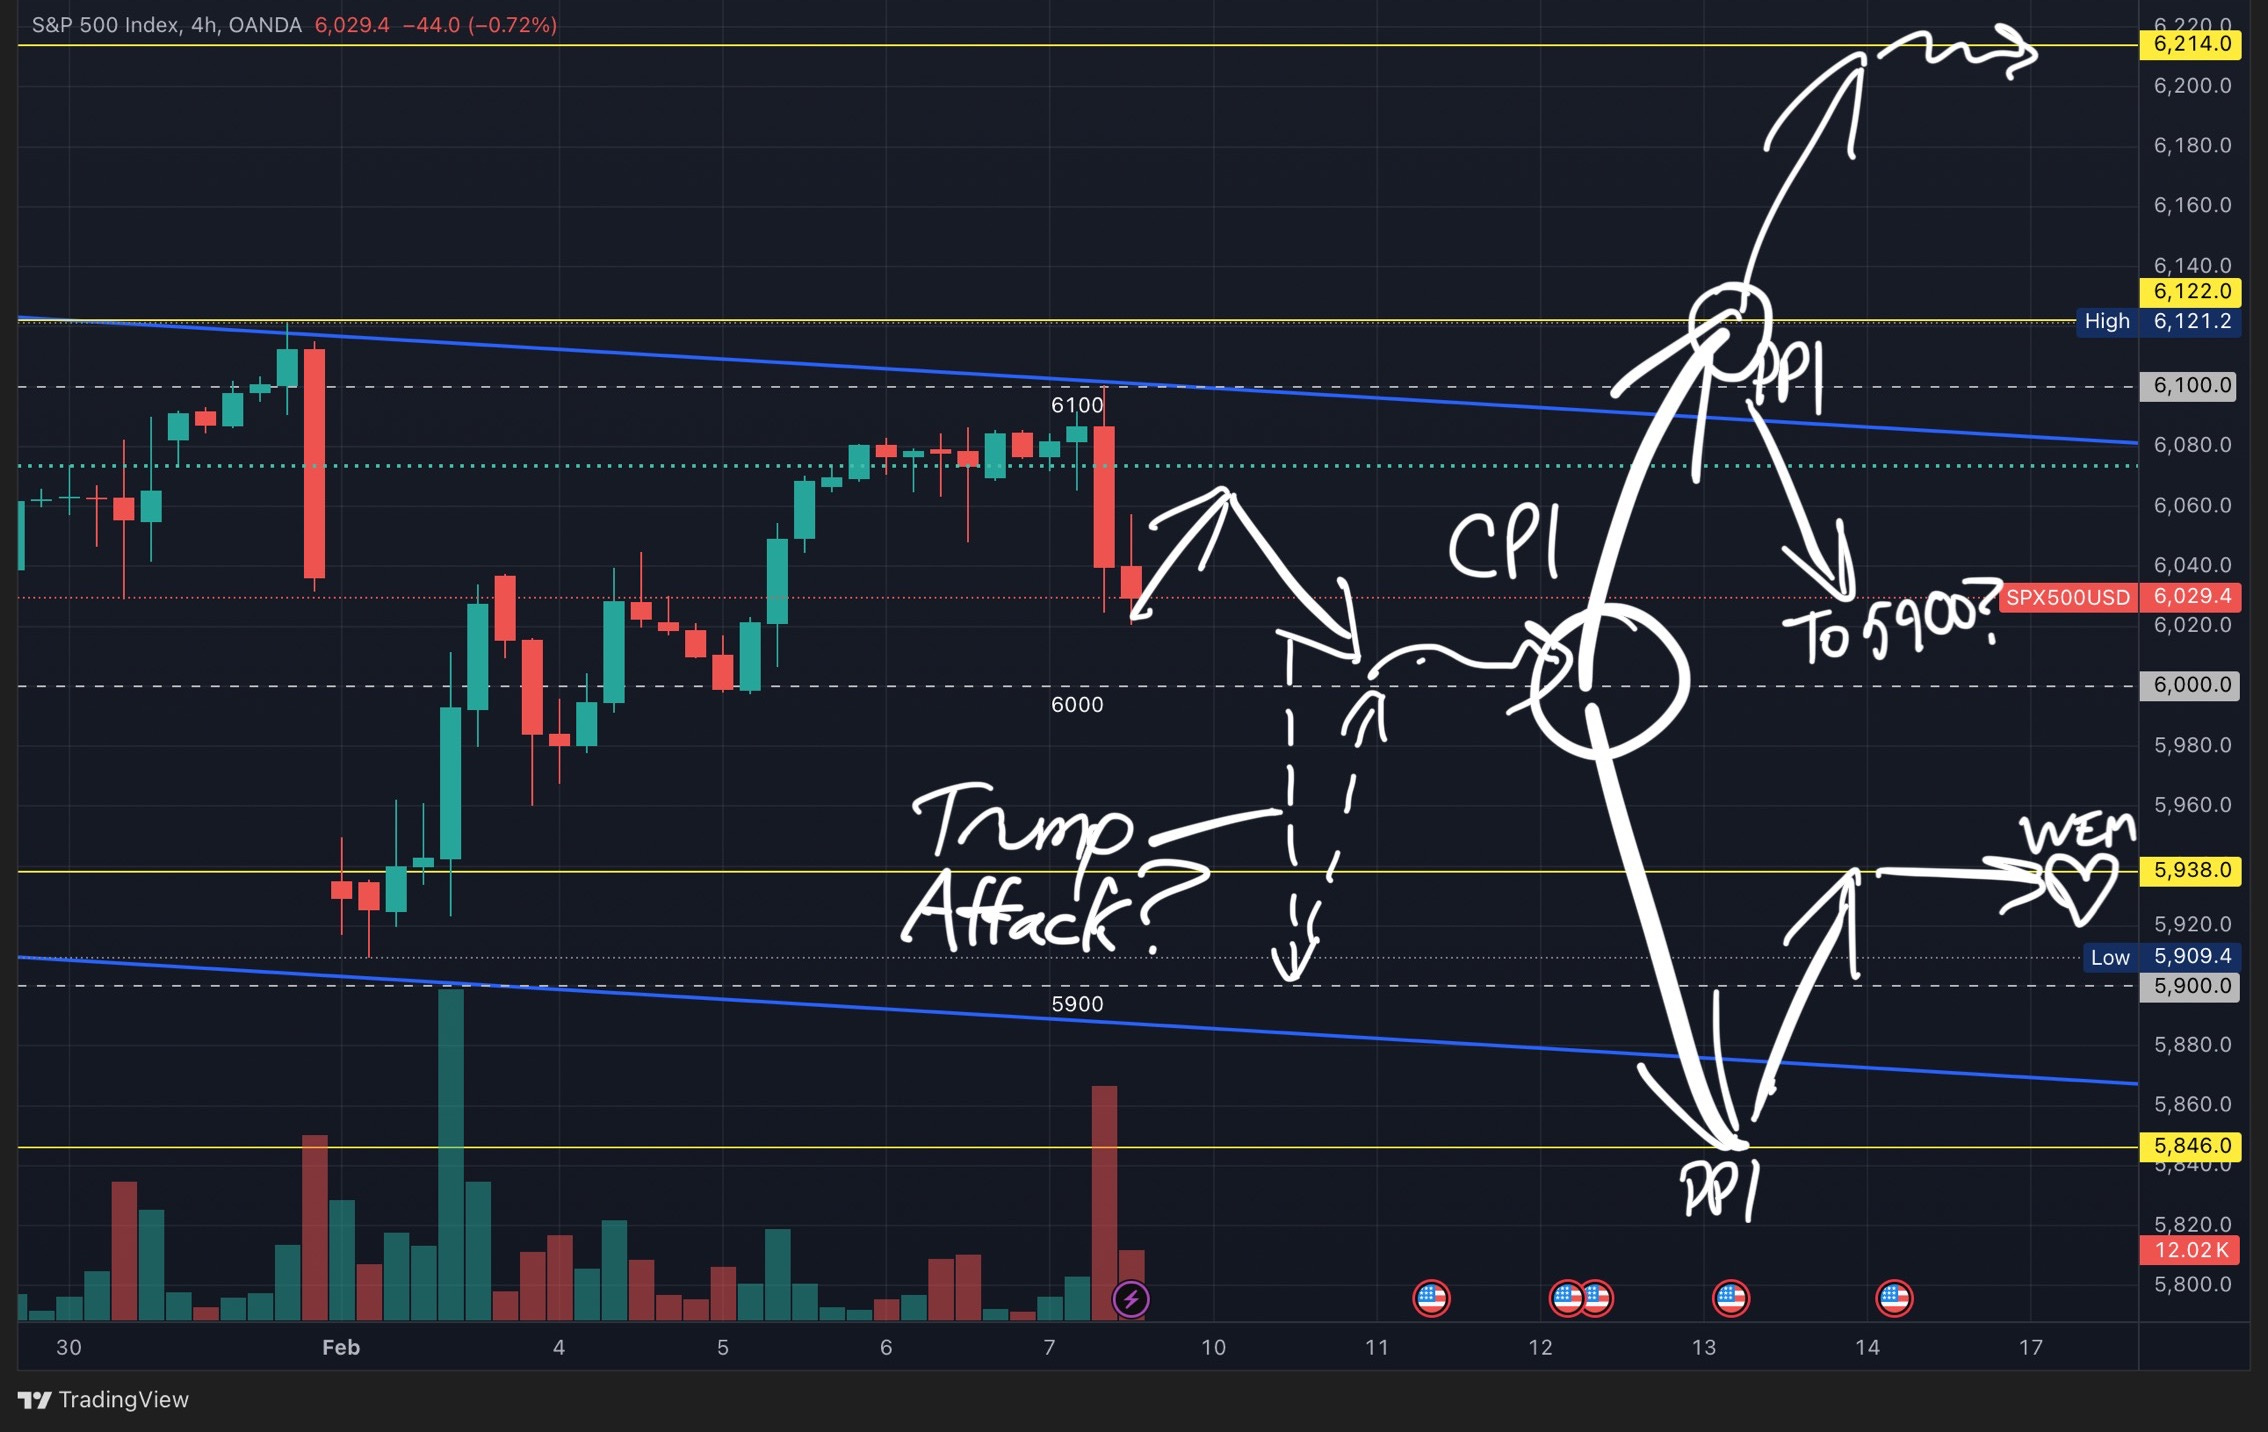
Finally, as a bonus, I’ll leave you with a few play-by-plays for different routes for navigating this volatile market this week:
Tradytics aggregates its data a little bit differently. Both services (as well as other gamma matchmaking services like Spotgamma or TradingVolatility) will weed out a lot of the lower volume options to avoid noise in the signal. A lot of option positions can also be deduced reliably as simple components of more complex strategies like condors, butterflies, and other extravagant means to woo your special someone.